
Getting started: Analytics
Thryve provides a broad variety of analytic indicators. This encompasses health status metrics, health metric dependencies, time pattern analytic indicators, all of which are presented in detail in the following chapters of this documentation.
Health Status Metrics
Thryve derives important health events and risk stratification measures from incoming sensor data. The following Thryve indicators are based on well-established algorithms for clinical use, carefully adapted to the data structure provided by wearables and home diagnostics. The availability of interpretation indicators depends on sufficient user information.
MetabolicEquivalent
MetabolicEquivalent to the ratio of the rate at which a person expends energy to the person's mass, while performing some specific physical activity compared to a reference, set at 3.5 ml of oxygen per kilogram per minute, which is roughly equivalent to the energy expended when sitting quietly. It can also be translated into kcal spent per hour and kg of body mass.
Required Input Data
MetabolicEquivalent is calculated in real-time using ActiveBurnedCalories, BurnedCalories or ActivityType, as well as the latest Weight measurement as an input. When no weight data is available, a default weight of 75kg is assumed.
| dataTypeId | name |
|---|---|
| 1010 | BurnedCalories |
| 1011 | ActiveBurnedCalories |
| 1200 | ActivityType |
| 5020 | Weight |
Output data
| MetabolicEquivalent Intraday | ratio of the rate at which a person expends energy to the person's mass (in this timeframe) | DataTypeID: 1012 | DOUBLE |
DailyPhysicalActivityAssessment
The daily physical activity assessment of Thryve computes a set of standardized metrics to assess activity intensities and activity durations throughout a day supporting data-driven decision making as well as more precise tracking of physical activity against health and fitness goals.
When looking at the daily activity of a user we evaluate the intensity of activities based on calculated maximum MET values reached within a fixed interval - we call this METmax. METmax is essential for assessing cardiovascular and metabolic health. High-intensity activities are often linked to improved heart health and overall fitness.
By quantifying activity durations at various intensity levels (low, mid, high), users and health professionals can better understand daily exercise patterns. This allows for more precise tracking of physical activity against health and fitness goals without dictating specific activities.
Input Data
Daily physical activity assessment requires only epoch metabolic equivalent as input data.
| dataTypeId | name |
|---|---|
| 1012 | MetabolicEquivalent |
Output data
| MetabolicEquivalentMax1Min Daily | Highest rolling average of metabolic equivalent within 1 minute period for a given day | DataTypeID: 1286 | LONG |
| MetabolicEquivalentMax5Min Daily | Highest rolling average of metabolic equivalent within 5 minute period for a given day | DataTypeID: 1287 | LONG |
| MetabolicEquivalentMax10Min Daily | Highest rolling average of metabolic equivalent within 10 minute period for a given day | DataTypeID: 1288 | LONG |
| MetabolicEquivalentMax60Min Daily | Highest rolling average of metabolic equivalent within 60 minute period for a given day | DataTypeID: 1289 | LONG |
| ActivityLowDuration Daily | sum of minutes (including the manually added values) spent with light activity | DataTypeID: 1101 | LONG |
| ActivityMidDuration Daily | sum of minutes (including the manually added values) spent with medium activity | DataTypeID: 1102 | LONG |
| ActivityHighDuration Daily | sum of minutes (including the manually added values) spent with high activity | DataTypeID: 1103 | LONG |
PhysicalActivityIndex
The physical activity index calculated by Thryve is based on a well established index for an overview over recurring physical activity habits that has been developed by Kurtze et al. The indicator covers intensity, frequency and duration of physical activity. The Index ranges from 0 to 45, whereas 0 means inactive; 1-20 medium active and >20 highly active. Studies have shown average values around 3.2 to 3.4.
Input data
The physical activity index indicator covers a reviews a timeperiod of 7 days. Any of the following data types needs to be available within each day of the timeperiod.
| dataTypeId | name |
|---|---|
| 1101 | ActivityLowDuration |
| 1102 | ActivityMidDuration |
| 1103 | ActivityHighDuration |
| 1287 | MetabolicEquivalentMax5Min |
Output data
| PhysicalActivityIndex Daily | Index on physical activity ranging from 0 to 45. Describing a timeframe of 7 consecutive days including the date of the daily value. | DataTypeID: 1013 | DOUBLE |
Sleep
The Thryve Sleep Evaluation enriches sleep data from all sources in near real-time, ensuring consistency and accuracy. While preserving existing epoch and daily data provided by wearables and sleep trackers, we enhance the data with additional insights—such as Sleep Latency and Sleep Interruption—which are often missing from standard device data.
A major challenge in sleep tracking is the lack of a standardized definition of sleep across different data sources and devices. Many wearables use varied criteria to define sleep cycles, leading to inconsistencies on a daily data level that make data comparison difficult.
To solve this, Thryve introduces the “Thryve Main Sleep” concept — a standardized approach that ensures sleep data is comparable and meaningful across different devices. By identifying the main sleep cycle each day, calculating precise daily and epoch-level metrics, and harmonizing fragmented data, Thryve creates a unified and reliable sleep dataset for both users and developers.
ThryveMainSleep
Thryve Main Sleep represents the longest continuous sleep cycle of the day, ensuring a standardized sleep data set. It is defined as a sleep period where interruptions (wake phases) do not exceed 30 minutes.
To enhance accuracy, Thryve:
✅ Cleans and consolidates data from multiple devices or sources, avoiding duplication.
✅ Stores both calculated daily data and cleaned epoch data used to derive the metrics.
✅ Introduces exclusive Thryve Main Sleep data types to maintain original data provided by data sources.
By adopting Thryve Main Sleep, developers gain access to a clean, structured dataset optimized for accurate sleep cycle visualization, and user insights—ultimately improving data integrity and usability.
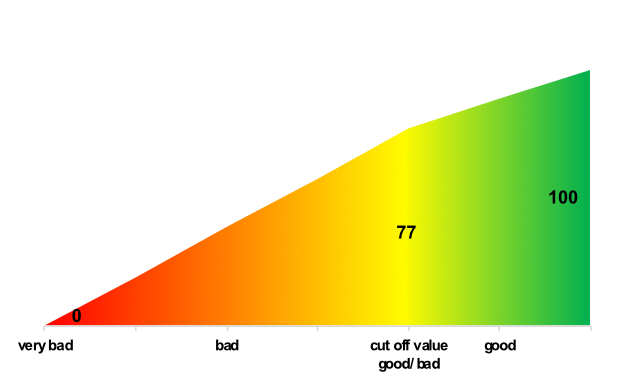
SleepQuality
Thryve models its SleepQuality Index following the model of the Pittsburgh Sleep Quality Index - PSQI [Buysse et al. (1989)], taking into account sleep duration, sleep efficiency, sleep latency and sleep interruptions. The Thryve indicator is scaled from 0 (=very bad sleep quality) to 100 (=very good sleep quality). Values above 77 signify good sleep quality, below poor sleep quality. For clinical use, please note that the original PSQI integrates further metrics and ranges from 0 to 21 with inverse order and a cutoff-value of 5 in order to enable direct comparison with previous clinical outcomes.
Input data
The following data types are used to calculate the
| dataTypeId | name | description |
|---|---|---|
| 2000 | SleepStateBinary | Boolean value indicating if the user is in a sleep state at the specified time. Used as a primary trigger for the algorithm and to calculate total sleep time. |
| 2001 | SleepInBedBinary | Boolean value indicating if the user is in bed at the specified time. Used when sleep state data is unavailable to calculate in bed duration. |
| 2002 | SleepREMBinary | Boolean value indicating if the user is in REM sleep at the specified time. Used to calculate REM sleep duration. |
| 2003 | SleepDeepBinary | Boolean value indicating if the user is in deep sleep at the specified time. Used to calculate deep sleep duration. |
| 2005 | SleepLightBinary | Boolean value indicating if the user is in light sleep at the specified time. Used to calculate light sleep duration. |
| 2006 | SleepAwakeBinary | Boolean value indicating if the user is awake in bed at the specified time. Used to calculate awake time, sleep interruptions, sleep latency, and time awake after wakeup. |
| 4101 | SnoringBinary | Boolean value indicating if the user is snoring at the specified time. Used to calculate total snoring duration during sleep. |
Output data
| SleepDuration Daily | Total duration of sleep in minutes during the main sleep cycle. Requires availability of SleepStateBinary. | DataTypeID: 2000 | LONG |
| SleepInBedDuration Daily | Total time spent in bed in minutes during the main sleep cycle. Requires availability of SleepInBedBinary. | DataTypeID: 2001 | LONG |
| SleepREMDuration Daily | Total duration of REM sleep in minutes during the main sleep cycle. Requires availability of SleepREMBinary. | DataTypeID: 2002 | LONG |
| SleepDeepDuration Daily | Total duration of deep sleep in minutes during the main sleep cycle. Requires availability of SleepDeepBinary. | DataTypeID: 2003 | LONG |
| SleepLightDuration Daily | Total duration of light sleep in minutes during the main sleep cycle. Requires availability of SleepLightBinary. | DataTypeID: 2005 | LONG |
| SleepAwakeDuration Daily | Total time spent awake in bed in minutes during the main sleep cycle. Requires availability of SleepAwakeBinary. | DataTypeID: 2006 | LONG |
| SleepLatency Daily | Time in minutes it took to fall asleep during the main sleep cycle. Requires availability of SleepAwakeBinary. | DataTypeID: 2007 | LONG |
| SleepAwakeAfterWakeup Daily | Time in minutes spent awake in bed after the main sleep cycle ended. Requires availability of SleepAwakeBinary. | DataTypeID: 2008 | LONG |
| SleepStartTime Daily | Start time of the main sleep cycle. Requires availability of SleepStateBinary. | DataTypeID: 2100 | DATE |
| SleepEndTime Daily | End time of the main sleep cycle. Requires availability of SleepStateBinary. | DataTypeID: 2101 | DATE |
| SleepInterruptions Daily | Number of times sleep was interrupted during the main sleep cycle. Requires availability of SleepAwakeBinary. | DataTypeID: 2102 | LONG |
| SleepMidTime Daily | Mid-point time of the main sleep cycle, used for day assignment. Requires availability of SleepStateBinary. | DataTypeID: 2103 | DATE |
| SleepEfficiency Daily | Percentage of time spent asleep while in bed (the amount of minutes spent asleep divided by the total minutes of time in bed) | DataTypeID: 2200 | LONG |
| SleepQuality Daily | Sleep quality index scaling from 0 to 100, where the values above 77 signify good sleep quality, while those below 77 signify poor sleep quality. | DataTypeID: 2201 | LONG |
| ThryveMainSleepStateBinary Intraday | Boolean value indicating if the user is in a sleep state during the main sleep cycle. | DataTypeID: 2300 | BOOLEAN |
| ThryveMainSleepInBedBinary Intraday | Boolean value indicating if the user is in bed during the main sleep cycle. | DataTypeID: 2301 | BOOLEAN |
| ThryveMainSleepREMBinary Intraday | Boolean value indicating if the user is in REM sleep during the main sleep cycle. | DataTypeID: 2302 | BOOLEAN |
| ThryveMainSleepDeepBinary Intraday | Boolean value indicating if the user is in deep sleep during the main sleep cycle. | DataTypeID: 2303 | BOOLEAN |
| ThryveMainSleepLightBinary Intraday | Boolean value indicating if the user is in light sleep during the main sleep cycle. | DataTypeID: 2305 | BOOLEAN |
| ThryveMainSleepAwakeBinary Intraday | Boolean value indicating if the user is awake during the main sleep cycle. | DataTypeID: 2306 | BOOLEAN |
| ThryveMainSleepLatencyBinary Intraday | Boolean value indicating if the user is in the sleep latency phase (awake before falling asleep) during the main sleep cycle. | DataTypeID: 2307 | BOOLEAN |
| ThryveMainSleepDuration Epoch | Total duration of sleep in minutes during the main sleep cycle. Requires availability of SleepStateBinary. | DataTypeID: 2300 | LONG |
| ThryveMainSleepInBedDuration Daily | Total time spent in bed in minutes during the main sleep cycle. Requires availability of SleepInBedBinary. | DataTypeID: 2301 | LONG |
| ThryveMainSleepREMDuration Daily | Total duration of REM sleep in minutes during the main sleep cycle. Requires availability of SleepREMBinary. | DataTypeID: 2302 | LONG |
| ThryveMainSleepDeepDuration Daily | Total duration of deep sleep in minutes during the main sleep cycle. Requires availability of SleepDeepBinary. | DataTypeID: 2303 | LONG |
| ThryveMainSleepLightDuration Daily | Total duration of light sleep in minutes during the main sleep cycle. Requires availability of SleepLightBinary. | DataTypeID: 2305 | LONG |
| ThryveMainSleepAwakeDuration Daily | Total time spent awake in bed in minutes during the main sleep cycle. Requires availability of SleepAwakeBinary. | DataTypeID: 2306 | LONG |
| ThryveMainSleepLatency Daily | Time in minutes it took to fall asleep during the main sleep cycle. Requires availability of SleepAwakeBinary. | DataTypeID: 2307 | LONG |
| ThryveMainSleepAwakeAfterWakeup Daily | Time in minutes spent awake in bed after the main sleep cycle ended. Requires availability of SleepAwakeBinary. | DataTypeID: 2308 | LONG |
| ThryveMainSleepStartTime Daily | Start time of the main sleep cycle. Requires availability of SleepStateBinary. | DataTypeID: 2400 | DATE |
| ThryveMainSleepEndTime Daily | End time of the main sleep cycle. Requires availability of SleepStateBinary. | DataTypeID: 2401 | DATE |
| ThryveMainSleepInterruptions Daily | Number of times sleep was interrupted during the main sleep cycle. Requires availability of SleepAwakeBinary. | DataTypeID: 2402 | LONG |
| ThryveMainSleepMidTime Daily | Mid-point time of the main sleep cycle, used for day assignment. Requires availability of SleepStateBinary. | DataTypeID: 2403 | DATE |
| ThryveMainSleepEfficiency Daily | Percentage of time spent asleep while in bed (the amount of minutes spent asleep divided by the total minutes of time in bed) | DataTypeID: 2500 | LONG |
| ThryveMainSleepQuality Daily | Sleep quality index scaling from 0 to 100, where the values above 77 signify good sleep quality, while those below 77 signify poor sleep quality. | DataTypeID: 2501 | LONG |
SleepRegularity (in development)
SleepRegularity
Input: SleepStateBinary and any kind of daily sleep data that are labelled with Trustworthiness=Plausible
Calculation schedule: weekly
Calculation method: Validation of the Sleep Regularity Index in Older Adults and Associations with Cardiometabolic Risk
| Daily | SleepRegularity | Established Indicator describing the likelihood that any two time-points 24 hours apart were the same sleep/wake state, across all days. | DataTypeID: 2220 | LONG |
VO2max
Daily data available for: Garmin, Polar, Multiple (Taking into account all connected sources)
Daily data soon to be released for: Apple Health,
Intraday data available for: Polar, Apple Health,VO2max
Input: WaistCircumference, PhysicalActivityIndex, (HeartRateResting or HeartRateSleep, using the latest value for calculation)
Calculation schedule: daily
Calculation method:
(1) female vo2max = 74.74 - (0.247 _ age) - (0.259 _ WaistCircumference) - (0.114 _ (HeartRateResting or HeartRateSleep)) + (0.198 _ PhysicalActivityIndex)
(2) male vo2max = 100.27 - (0.296 _ age) - (0.369 _ WaistCircumference) - (0.155 _ (HeartRateResting or HeartRateSleep)) + (0.226 _ PhysicalActivityIndex)
Calculation consideration: SleepQuality is only calculated when there birth date is present. Moreover, gender isn't present, male is taken as assumed value.
| Daily | VO2max | maximum cardiovascular oxygen intake in mol per minute and kilogram of body weight | DataTypeID: 3030 | DOUBLE |
| Intraday | VO2max | maximum cardiovadcular oxygen intake in mol per minute and kilogram of body weight | DataTypeID: 3030 | DOUBLE |
FitnessAge
Daily data available for: Multiple (Taking into account all connected sources)
FitnessAge
Input: VO2max, Age, Gender
Calculation schedule: daily
Calculation concept: derived from Firstbeat Technologies whitepaper
Calculation consideration: If the gender isn't present, male is taken as assumed value. If the age isn't present, 40 is taken as assumed value.
| Daily | FitnessAge | age-equivalent of cardiorespiratory fitness level | DataTypeID: 3031 | LONG |
VO2maxPercentile
Daily data available for: Multiple (Taking into account all connected sources)
VO2maxPercentile
Input: VO2max, Age, Gender
Calculation schedule: daily
Calculation method: based on Cooper Institute®
Calculation consideration: If the gender isn't present, male is taken as assumed value. If the age isn't present, 40 is taken as assumed value.
| Daily | VO2maxPercentile | percentile of VO2max in relation to age and gender specific overall population | DataTypeID: 3032 | LONG |
FraminghamRiskScore
Daily data available for: Multiple (Taking into account all connected sources)
FraminghamRiskScore
Input: SmokingStatus, Gender, BloodPressureSystolic, FamilyCVDHistory, HighBloodPressureTreatment, DiabetesStatus, BloodCholesterolHDLC, BloodCholesterolTotal
Calculation schedule: daily
Calculation consideration: If any value is not present, the followings values are assumed: BloodCholesterolHDLC=1.25, BloodCholesterolTotal=6.0, Gender=Male, FamilyCVDHistory=False, HighBloodPressureTreatment=False, DiabetesStatus=False, SmokingStatus=0
| Daily | FraminghamRiskScore | Estimated individual risk for cardiovascular disease within 10 years | DataTypeID: 3040 | DOUBLE |
FatalCVDRiskSCORE
Daily data available for: Multiple (Taking into account all connected sources)
FatalCVDRiskSCORE
Input: SmokingStatus, Gender, Age, BloodPressureSystolic, BloodCholesterolTotal
Calculation schedule: daily
Calculation consideration: if Age or BloodPressureSystolic is missing, FatalCVDRiskSCORE will not be calculated. If any value is not present, the followings values are assumed: BloodCholesterolTotal=6.0, Gender=Male, SmokingStatus=0.
| Daily | FatalCVDRiskSCORE | estimated individual risk for fatal cardiovascular disease within 10 years | DataTypeID: 3041 | DOUBLE |
ThryveFatalCVDRisk
Daily data available for: Multiple (Taking into account all connected sources)
ThryveFatalCVDRisk
Input: fatalCVDRiskSCORE, Age, Gender, VO2max
Calculation schedule: daily
Calculation concept: The job compares user's calculated "expected VO2max" based on his/her age & gender to user's current VO2max, and verify if user is fitter then expected or not. If user is fitter than the original ThryveFatalCVDRisk is lowered, and vise versa.
Calculation consideration: if fatalCVDRiskSCORE, age or VO2max is missing, ThryveFatalCVDRisk will not be calculated. If Gender is not present, male is as a assumed value.
| Daily | ThryveFatalCVDRisk | estimated individual risk for fatal cardiovascular disease within 10 years adjusted for cardiovascular fitness | DataTypeID: 3042 | DOUBLE |
AtrialFibrillationDetection
On request: Thryve WearOS SDK
| Daily | AtrialFibrillationDetection | atrial fibrillation detected on this day | DataTypeID: 3120 | BOOLEAN |
| Intraday | AtrialFibrillationDetection | atrial fibrillation detected in this timeframe | DataTypeID: 3120 | BOOLEAN |
AlcoholConsumption
Daily data available for: Fitbit, Garmin, Withings, Oura
AlcoholConsumption
Input: HeartRateSleep
Calculation schedule: daily
Calculation method: HeartRateSleep values are divided into 4 segments. If one single segment is higher than the average of the remainings, then it indicates the assumption of HeartRateSleep anomaly or AlcoholConsumption status
| Daily | AlcoholConsumption | Metabolic stress during sleep detected | DataTypeID: 5010 | LONG |